
KPlot v1.1a
09.02.2019
Operating Systems: Windows
Language: C++
Last Edit: 07.06.2019 - 19:18
What is KPlot
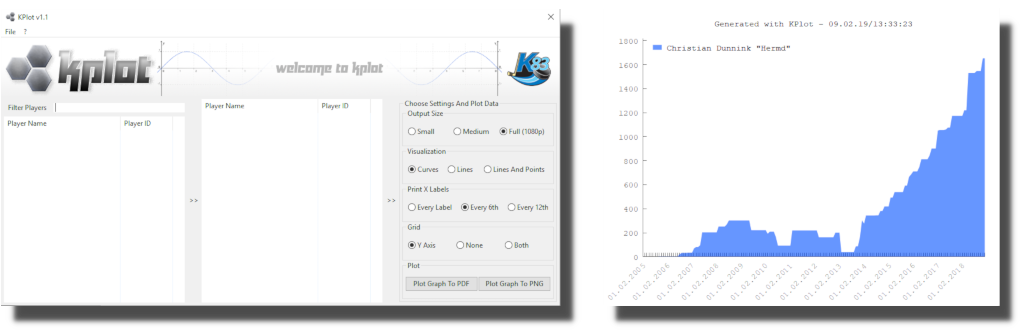
KPlot is a software application, written in C++, to display and compare active ITHF table hockey players' rank points over time in two-dimensional graphs. You just have to select the players which you want to display or compare with each other from a list. Then KPlot will gather the player data from the official ITHF website. It will then process the data, letting you set a specific time frame of interest, and finally pass the data on to Gnuplot to create a PDF or a PNG output file for you.
Installation / Dependencies
KPlot is portable software. This means you can just copy the KPlot folder to any location you like, e.g. your desktop or usb stick, and run it from there. It does not require an installation process. KPlot does require Gnuplot to create the visual representations of the data it gathers. Since Gnuplot is both free and portable, we include a copy of Gnuplot 5.26 in the KPlot folder you get through our download. No additional setup for Gnuplot is required.
How to use KPlot
When you start KPlot it will begin to download the player names from the official ITHF website and fill them into the source list on the left. Since there are a lot of player names, you can filter the source list by entering a filter criteria into the text box above the list.
When you have found a player you want to add to the graph just double click on the name in the source list to add him to the target list, located in the middle of
the user interface.
You can remove players from the current graph by double clicking on their names in the target list.

Output Settings
Before you hit either of the "Plot Graph"-buttons which will create the PDF or PNG file you, you may want to set some of the output settings.
First of all there is the resolution setting, which is self explanatory. Next there is the Visualization category with three options. "Curves" will draw the
players' rank points as filled curves with tranparency. This mode looks best when used with a maximum of two to three players. The "Lines" option will draw the
data as simple colored lines. Use this mode for 3-9 players. The last mode is "Lines And Points". It draws lines with added markers at datapoints and can distinguish 10 and more players.
Next you can adjust how many date labels will get printed at the bottom of the graph. You can choose between "Every Label", "Every 6th" and "Every 12th" label. The more
data points there are, i.e. more years of data for a single player, the more crowded the date labels can become. In case the labels become unreadable you can spread them by
selecting the "Every 12th" option, or, if there are only a few years of data you can select the "Every Label" option to show all date labels.
Finally you can adjust how the background grid will be drawn. Similar to the date labels, the x grid will not look good when there is a lot of data. Therefore the default
setting is "Y Axis", which will only draw horizontal grid lines. "None" will remove grid lines completely, while "Both" will draw horizontal and vertical grid lines.

Creating a Graph
To finally create the graph press the "Plot Graph To PDF" or the "Plot Graph To PNG" button.
A file dialog will show up, letting you set the output file name. By default it will name the file using a date and
time combination.
After setting the file name another window will pop up. This is the time frame selection window. It allows you to narrow
down the time which should be visible in the graph using two sliders. The top slider sets the start date of the graph while
the bottom slider sets the end date. Those dates are limited to the time present in the data of all players included in the
current graph.
The above picture shows three graphs which were created with different visualization settings, different label settings as well as with a different time frame selection, but all using the same data.
Color Setup
KPlot comes with a basic color palette to distinguish between up to 9 players. You can open up a color setup dialog through the
application menu. In the dialog, click on any color to open a color picker window.
By default it will only show some default system colors.
Hit the button in the lower part that reads "Define Colors" to fully open up the dialog and specify any color you like.
On the right you can set the transparency strength for the curve visualization. The upper value is used for up to 4 players. The lower slider controls the values for more 4-8 players.

Where to get KPlot
You can download KPlot, free of charge, right here from our website. Head over to the development download section to get your copy.
Please read the license and copyright notice file provided in the downloaded zip file.
In short:
- You can download and use the software free of charge.
- You can copy and distribute the software free of charge.
- You can not sell the software.
- The software comes "as-is" without any warranties whatsoever. Use at your own risk.
We hope you will have a lot of fun creating graphs and watching your favorite table hockey players rise :)